NYC District Decarbonization Explorer
Clustering NYC building energy data for district-scale systems
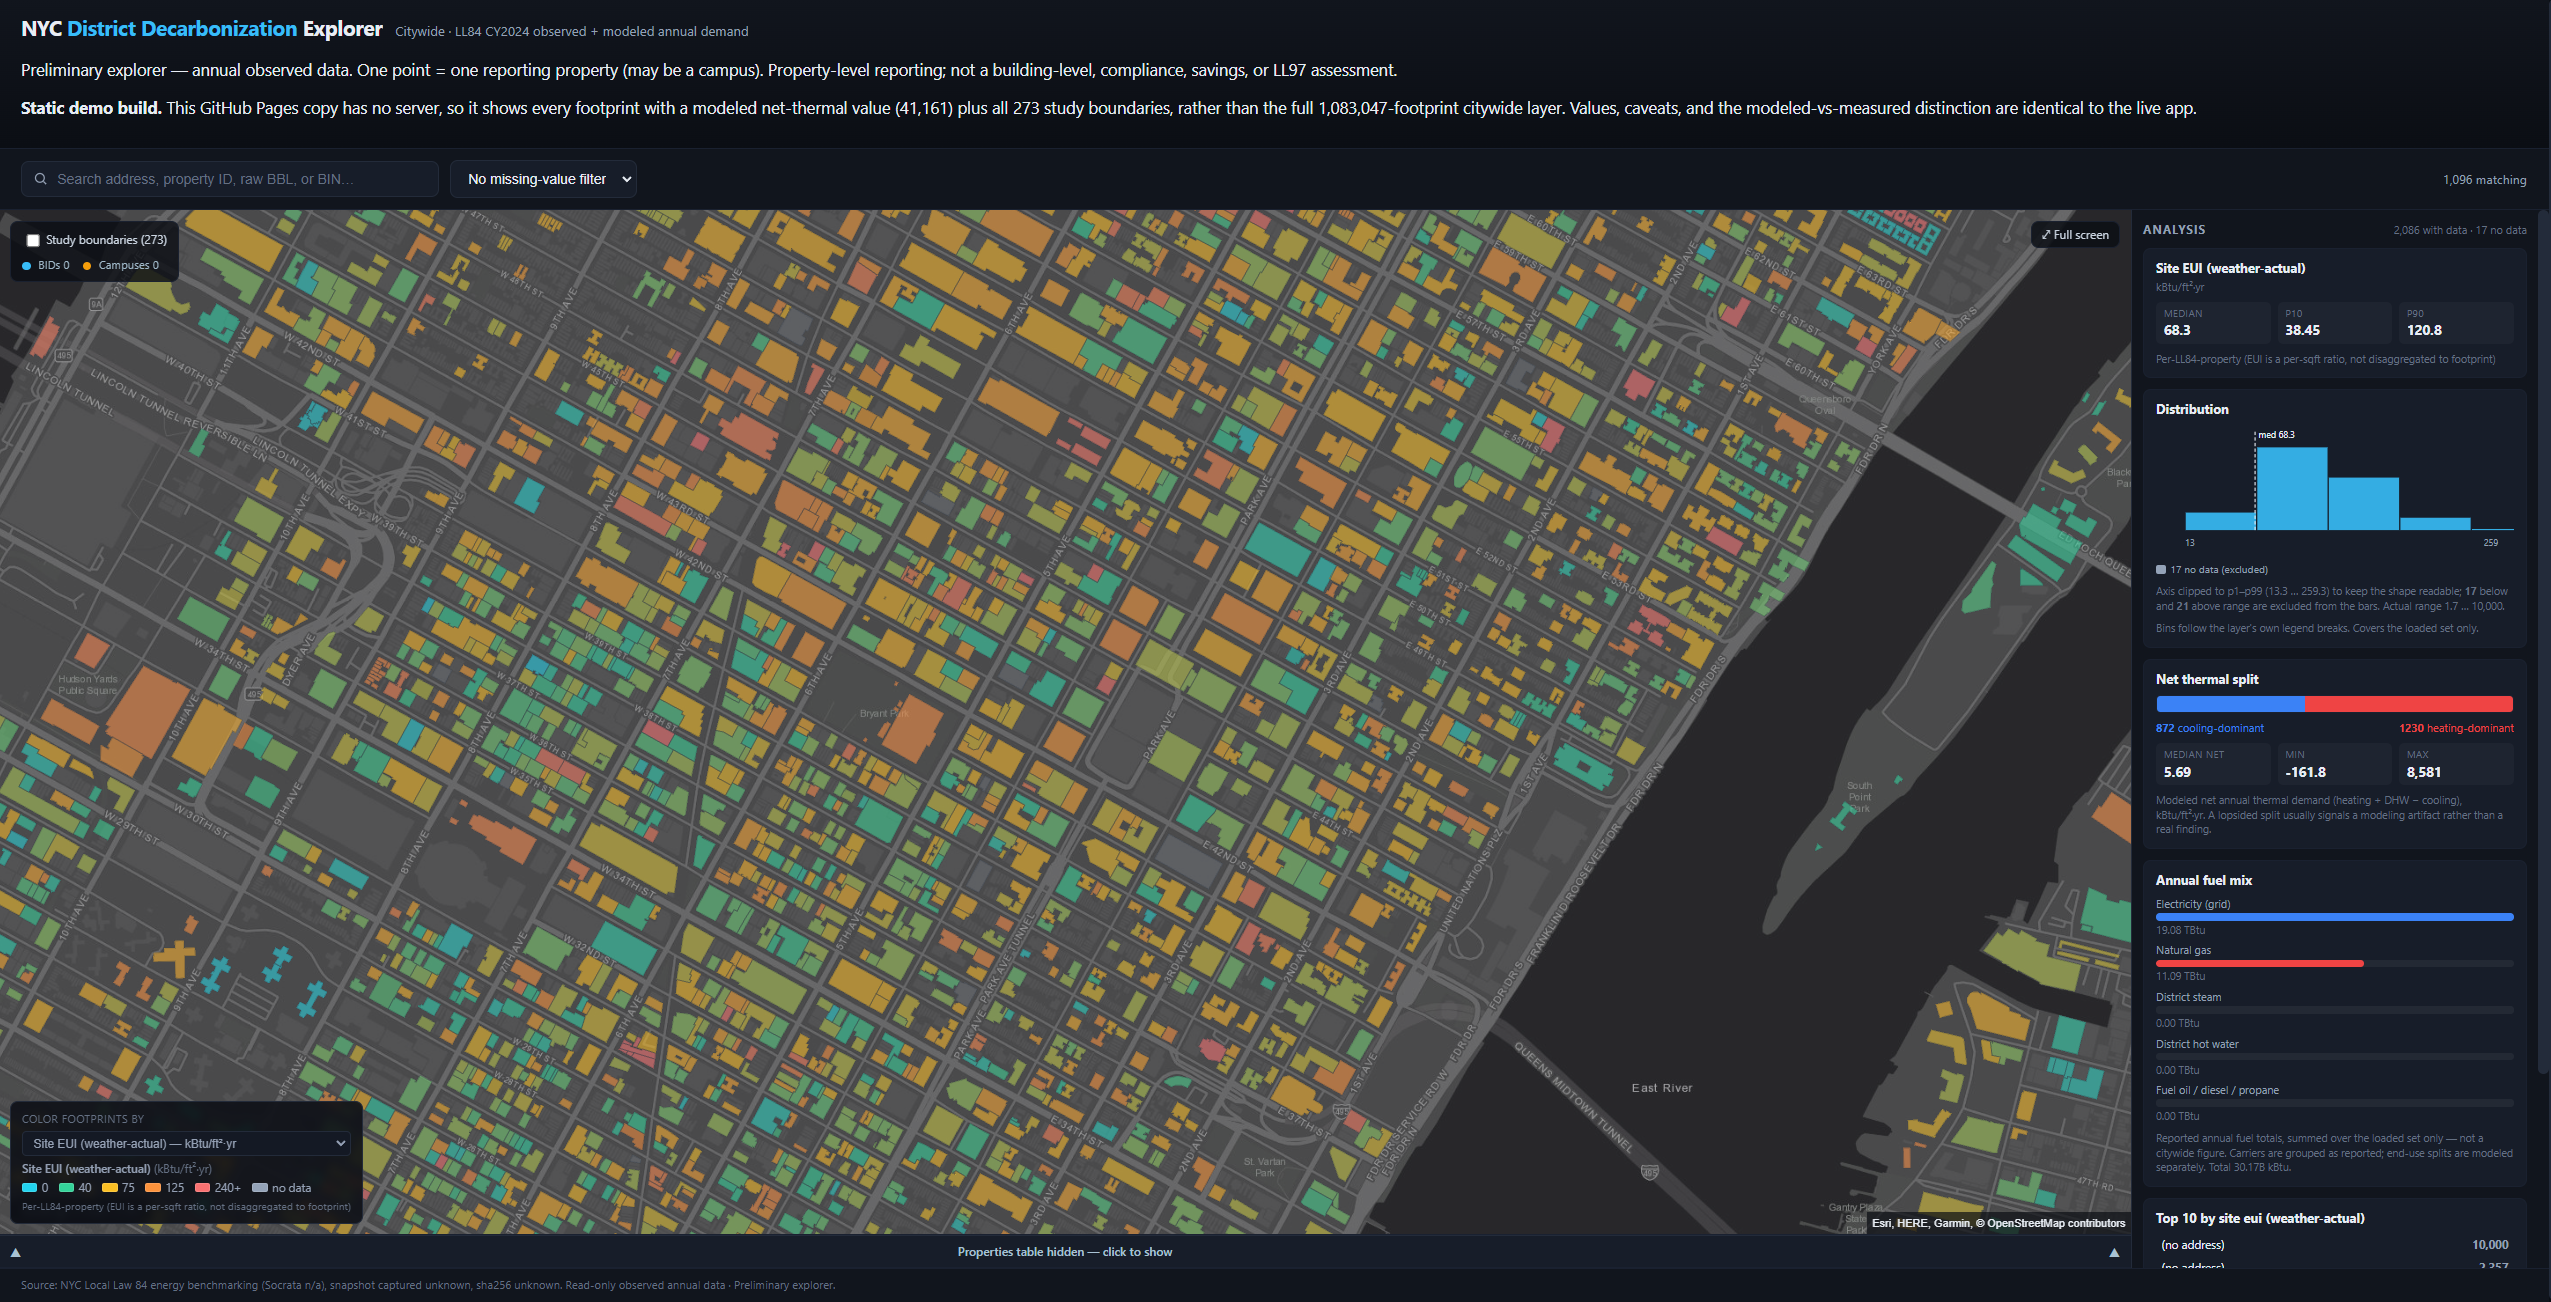
An exploratory tool using NYC Local Law 84 building energy data to identify clusters of buildings that may be suitable for district-scale energy systems, including areas with high energy demand and favorable thermal load characteristics.
Methodology
What it shows
Every DOB building footprint is drawn, colored by the selected energy metric. Interactive metrics include purchased electricity and natural gas (annual kBtu), total location-based GHG emissions (tCO2e/yr), and property floor area (self-reported LL84 GFA). The headline layer is net thermal demand (kBtu/ft2/yr): modeled space heating plus domestic hot water minus modeled cooling, per square foot per year — positive values (red) mark buildings with net heating demand to serve, negative values (blue) mark net cooling demand. The diverging color breaks are drawn from the pilot dataset's own quantiles rather than a fixed palette.
How the numbers are made
Observed values are reported at LL84 property grain. Where one reporting property spans multiple footprints (a campus), property totals are apportioned across footprints with estimated area-weighted shares, and every apportioned record carries explicit flags and a conservation check.
Modeled values are derived from observed LL84 fuel totals using fixed archetype share parameters constrained by the benchmarking data — a heating efficiency (eta) of 0.8 for gas and a cooling COP of 3.0. The model asserts an energy-conservation receipt (implied efficiency <= 1.0, delivered heat can never exceed fuel input) on every build; that invariant is what catches an omitted heating fuel such as steam or fuel oil before it can reach the map. Footprints without an LL84 record are present for coverage, with end-use demand left purposely null.
Data engineering
The citywide layer is a deterministic build pipeline, not a scratch export. Each build stage (LL84 fetch, footprint join, demand model, BID fetch, campus and ownership-cluster construction) records its inputs, checksums, and row counts in a manifest that is verified byte-for-byte against the output database — a stale manifest fails loudly rather than silently describing wrong data. Large builds stage on native disk because the Windows mount turns a 90-second build into an hours-long one.
Serving uses viewport refetching against an R-tree index (roughly 0.4 s per query) because 1.08 million features cannot be one payload. The public static demo submits to the same constraint with a pre-filtered footprint set (41,161 modeled-demand footprints plus all 273 boundaries) and labels itself clearly as a static demo.
What we are trying to do with it
District-scale energy systems — thermal networks, shared ground-source loops, waste-heat recovery — live or die on siting: the demand has to be big, dense, and matched. This tool produces the demand side of that screening, for every building in the city, in a form a planner can point at: a neighborhood's net thermal footprint, its ownership cluster's concentration, and the observed fuel records behind both. The intended users are planning staff, energy-modeling teams, and anyone assessing where a more expensive district study would even be worth conducting.
The next obvious step — thermal matching on the supply side, and scenario costing — is deliberately out of scope. The tool's value comes from being an honest, reproducible, fully-public screening layer that other, more specific studies can build on.